
Every web app has a limit to its load capacity. If the load exceeds the point of maximum capacity then the app will slow down, start showing errors or it can even become useless. So, the development team or QA analysts need to include load testing as an integral part of their performance testing.
Various tools are available in the market that can help you perform your tests. One such tool that can help you out with load testing is known as JMeter. Being used widely for load testing, hence the term JMeter load testing.
Before we dive into the details of JMeter load testing, let us first discuss the basics of load testing.
What Is Load Testing?
Many types of performance testing are conducted on a web app. Load testing is one of them. Performance testing is done to check how the system will perform under different real-life scenarios whereas load testing will analyze the maximum amount of load a system can handle.
It also identifies the maximum operating capacity of the app. When you conduct load testing, it also tells you if the present infrastructure is capable enough to run the web application. Another thing the test tells you is how many users can work on your app concurrently.
Tools for Load Testing
Conducting load testing is very important as it can tell you the capacity of the app about how many users’ demands it can fulfill at a time. Although we already said, we are going to discuss JMeter in this blog for load testing, there are many more such tools available in the market. Some of them are as mentioned below:
- LoadNinja
- LoadRunner
- WebLoad
- LoadUI
In this article, we are going to discuss JMeter for load testing. So let us understand what this tool is, why you should use it for load testing, and hope you can use it.
What Is JMeter?
Apache JMeter, popularly known as JMeter, is a JavaScript-based open-source application that is designed to measure the performance and test the functional behavior of your application.
Initially, JMeter was created to test applications but over time as the tool expanded with many other test functions, it became more advanced. You can now conduct load testing, functional testing, and performance testing using JMeter. You can use this software testing tool to simulate an environment where a significant amount of load is applied on a server or a group of servers to check their strength and determine how they perform under different types of loads.
Why Do We Use JMeter for Load Testing?
There are many reasons for you to use JMeter including –
- Free of cost: Since the tool is open-source, there won’t be any licensing fees to use it.
- Performance testing: JMeter is used for performance load testing for web apps, databases, web services, and more.
- Platform independent: Being a completely JavaScript-based software, you can run JMeter on any platform you need.
- Supports: Apart from performance testing, JMeter also supports non-functional tests like distributed testing, web service testing, and stress testing.
- Recording and playback: Along with the drag-and-drop feature that helps you develop an app quickly, JMeter comes with a record and playback feature for testing. This allows you to record your tests and then analyze them later.
- Customizable: JMeter is a highly-customizable software testing tool.
- Community support: This tool has the support of a strong community of developers. Various plugins are also available that can help you with different kinds of analysis.
How to Perform JMeter Load Testing?
Now, the basic requirement of JMeter load testing is that you have installed the tool in your system. If you haven’t then you can download it from here. Now that’s taken care of, let us move on to a step-by-step process for creating a basic test plan.
1. Adding a Thread Group
- Open the JMeter window.
- You can see now that the window has two sections. On the left side, you will be able to see all the added elements whereas on the right side, you can see the configurations of all those elements.
- Save the test plan after renaming it, let’s say – FirstJMeter.
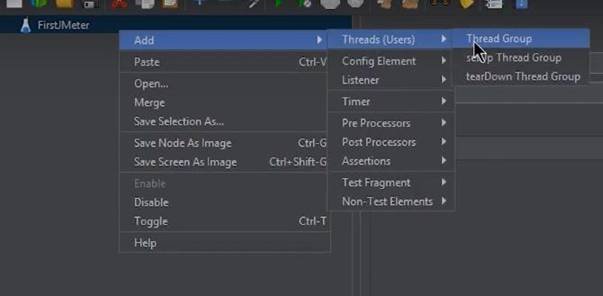
- Right-click on the test plan.
- Go to add -> Threads (Users) -> Thread Group
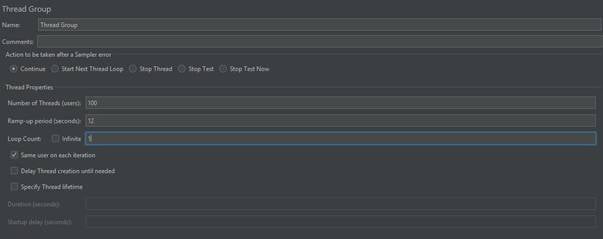
After clicking on the Thread Group, you will be able to see three different things on your screen related to your load test.
- The number of threads (users): It shows how many users or the number of threads will JMeter use in the test. Make it 100.
- Ramp-Up Period (in seconds): This reflects the time taken by JMeter to conduct a test with the threads. Keep it for 12 seconds. After every 12 seconds, JMeter will restart the test.
- Loop Count: It’s the number of times you want to conduct your test. For now, keep it 1.
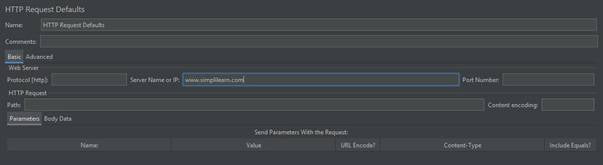
2. Add an HTTP Request Default
An HTTP request default is added so that every HTTP request is sent to the same server.
- Right-click on the Thread Group.
- Go to Add -> Config Element -> HTTP Request Defaults.
- A window will appear where you can fill in the name or the IP address of another server whose test you want to conduct.
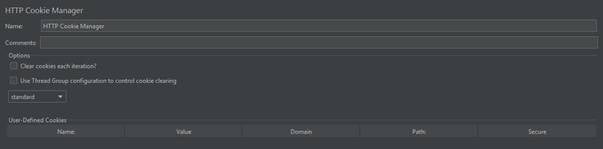
3. Add an HTTP Cookie Manager
Adding an HTTP cookie manager to your thread group will allow you to support cookies.
- First, click Right on the Thread Group.
- Go to Add -> Config Element -> HTTP Cookie Manager
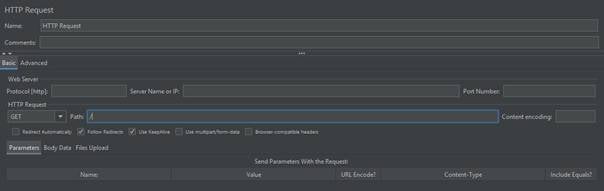
4. Add an HTTP Request Sampler
- Right-click on the Thread Group.
- Go to Add -> Sampler -> HTTP Request
- HTTP request will give a path to every thread and user that will request under the HTTP Request Section. For every thread to have access to the homepage of your server, set it to “/”.
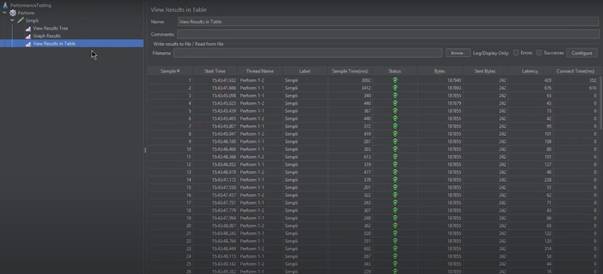
5. Add a View Results in Table Listener
The listener is something that can be used to provide the results of the test. Various types of listeners are available when you are using JMeter. A lot more can be added by using their plugins. A Table is always easy to read and interpret so, we are going to use it as our listener for this test.
- Right-click on the Thread Group.
- Go to Add -> Listener -> View Results in Table
To get the outputs of a test in a CSV file, you can type the value for Filename.
6. Run the Basic Test Plan
- First of all, Save your test plan.
- Then in the Table click on View Results
- Now, click on the Run button.
- The results of the test will be displayed in your selected listener, in this case, it’s a Table.
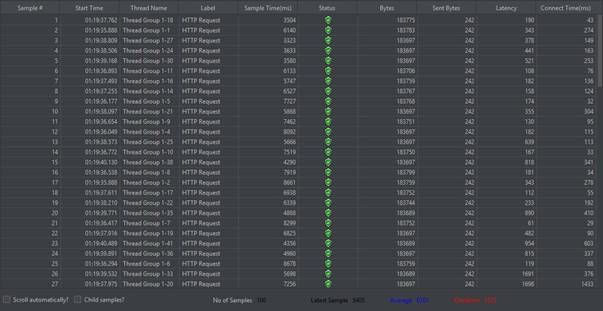
In the results, the status of all the requests is shown as “Success”. Besides that, you get to see two more columns namely Sample Time (ms) and Latency. The Sample Time shows how many milliseconds did it take for the server to complete the user request.
Whereas the Latency shows the time difference between the time when JMeter sent the request and the time when the initial request was received.
You can redo the same demo test with little fluctuations in values of the number of threads and the number of loops. When these values are changed, the sample time value, as well as other output values, will start changing too. This will show you whether the system is fine or it is overburdened.
Conclusion
After reading this article, I hope you get the gist of how you can use JMeter to perform load testing. Refer to the official documentation of the software if you want to conduct more complex tests. Thanks for reading.


Leave a Reply